Monitoring water quality in the Vasse Wonnerup wetlands and Geographe waterways is an important component of the Revitalising Geographe Waterways program, especially over summer months, where monitoring is used to inform management decisions.
The Department of Water and Environmental Regulation (DWER) undertakes routine monitoring of catchment waterways and wetlands all year round with monitoring increased over summer months.
Dr Kath Lynch, District Manager said water quality, nutrients and phytoplankton are monitored weekly in the Vasse estuary and Lower Vasse River over summer with physical water quality parameters (salinity, temperature, pH, and dissolved oxygen) logged every 15 minutes at four monitoring sites in the Vasse estuary and one in the Lower Vasse River.
“This information is telemetered providing managers and community access to the data daily. The Water Corporation also log water levels in the Vasse Wonnerup wetlands every 15 minutes.
“Having real time data is critical for the management of the Vasse estuary.
“When making decisions on allowing water into and out of the estuary we use both water quality and water level information to try and get the best outcome for water quality and ecology.”
The chart below shows water levels, gate management and logger data from December and early January both upstream and downstream of the Vasse surge barrier.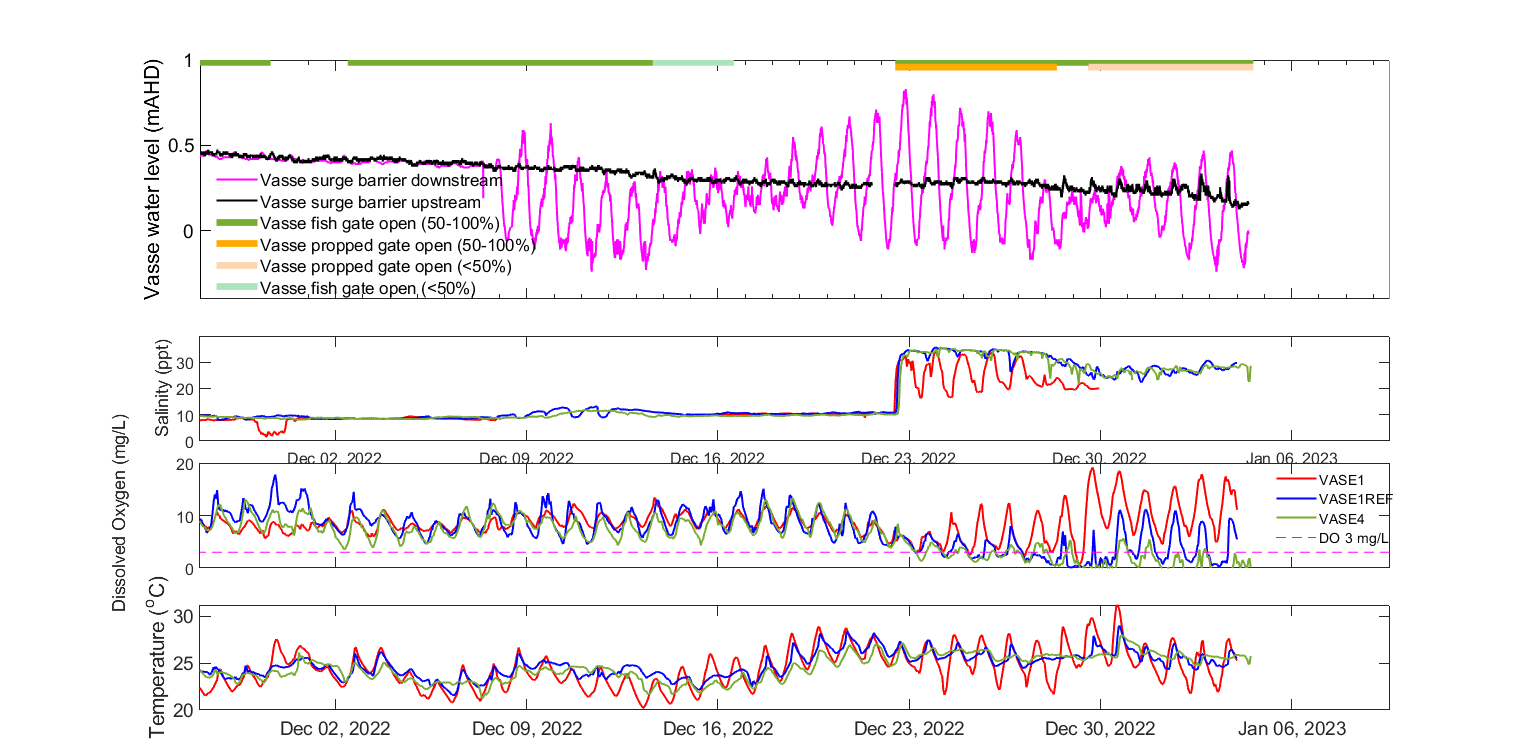
Above: Water level, gate management and logger data since 2 December 2022
Kath said monitoring of a large algal bloom and water quality in the Vasse estuary in late December resulted in opening gates on the Vasse surge barrier.
“We knew that water quality was deteriorating but we still had quite high water levels in the estuary. Using predicted tides and water level data we were able to recommend an opening regime of the gates to allow poor water to flow out of the estuary and seawater to flow in,” said Kath.
The chart below is called a ‘Surfer Plot’ and shows both changes along the estuary and within the water column. The system was very stratified with strong salinity stratification (22 to 30 ppt) and mild temperature stratification (23 to 25oC). The stratification was much worse upstream and improves closer to the surge barrier due to better mixing there.
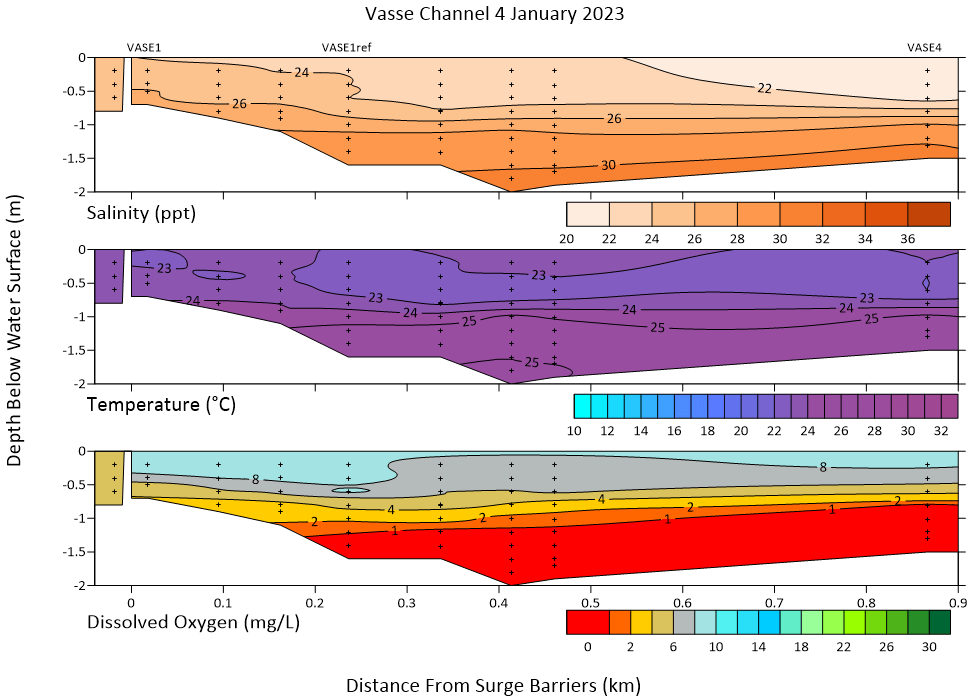
Above: Surfer plot showing temperature, dissolved oxygen and salinity stratification in the Vasse Estuary
Kath said for the last two years a Section 40 Authorisation has been required to allow seawater into the Vasse estuary due to the potential impacts on the ecology.
“Thankfully we were able to use the data to reduce the algal bloom and still keep water level declines in the estuary within historical limits as is required under the Section 40 Authorisation.
“The Section 40 includes criteria for opening and closing gates on the Vasse surge barrier which allows seawater inflows into the estuary in response to poor water quality and defines maximum water levels of seawater inflows to protect waterbird habitat,” said Kath.
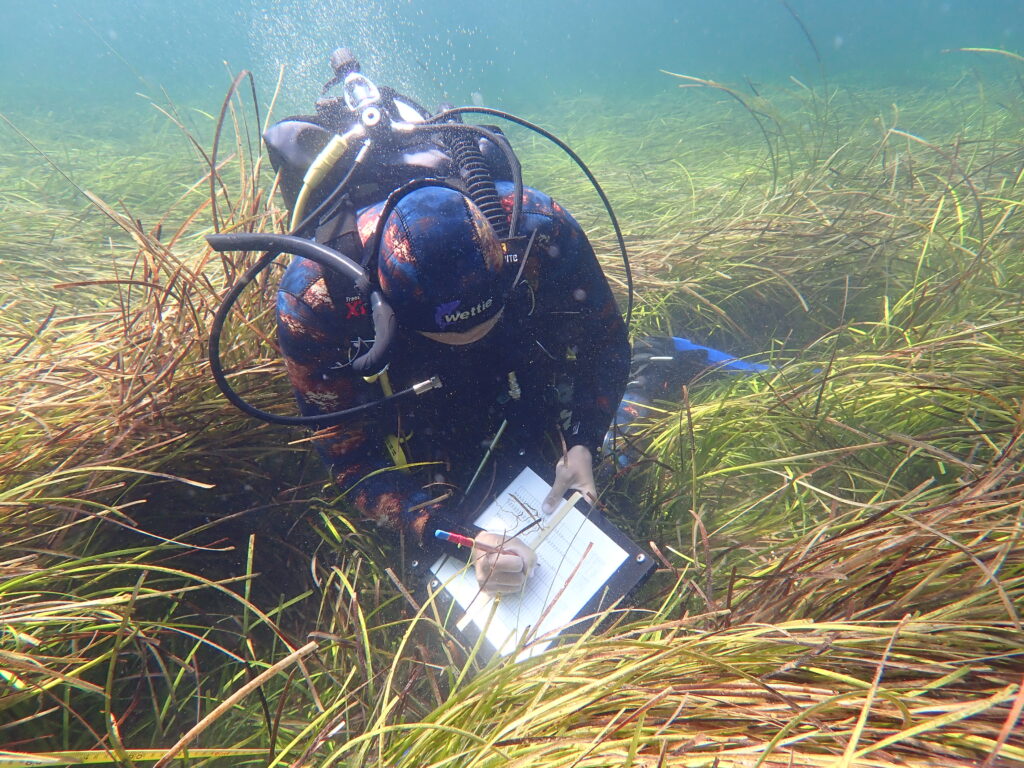
A team of people support the monitoring and management of the Revitalising Geographe Waterways program. Monitoring is undertaken by DWER Southwest regional monitoring team in boats and canoes often in challenging conditions over summer months. The data is analysed by DWER scientists and phytoplankton ecologists in Perth and sent to managers who respond to the data (Department of Health) by installing health warning signs (City of Busselton), opening, and closing gates on the surge barriers (Water Corporation) and responding to the community (Vasse Wonnerup wetlands Partnership).
Additional monitoring will continue over summer/autumn months to support management of Geographe waterways.
For more information on management of the Vasse Estuary is available on the Vasse Wonnerup Management factsheet.
Links to water logger data are publicly available via the links below:
VASE1 just upstream of the surge barrier:
https://kumina.water.wa.gov.au/waterinformation/wir/reports/publish/610019/610019.htm
VASE1REF deepest point in Vasse channel (upstream)
https://kumina.water.wa.gov.au/waterinformation/wir/reports/publish/6101227/6101227.htm
VASE4 close to top of Vasse channel
https://kumina.water.wa.gov.au/waterinformation/wir/reports/publish/6101230/6101230.htm
VASE1DS downstream of surge barrier
https://kumina.water.wa.gov.au/waterinformation/wir/reports/publish/610022/61022.htm